experiment · evergreen
Measurements
Four charts from the logs and the 45 episodes: jumps on chunk boundaries, waiting and move time, the demonstrations, the cells tried. And what has not been measured.
Four charts drawn from what was already on disk after the evening of 2026-10-10: the command logs of the arm, the frames saved with them, and the joint data of the 45 demonstrations. No run was made for this page and nothing is compared with a baseline, because none was measured.
The numbers are small: three direct policy runs, ten game-script logs, 45
episodes. Points are shown one by one, nothing is fitted, and no chart is a
success rate. Every number on this page is in
benchmarks/data/key_numbers.csv in the project repository, and every
definition is a constant in benchmarks/extract.py; the full page, with two
more charts, is docs/benchmarks.md.
Jerky motion: queued against sync
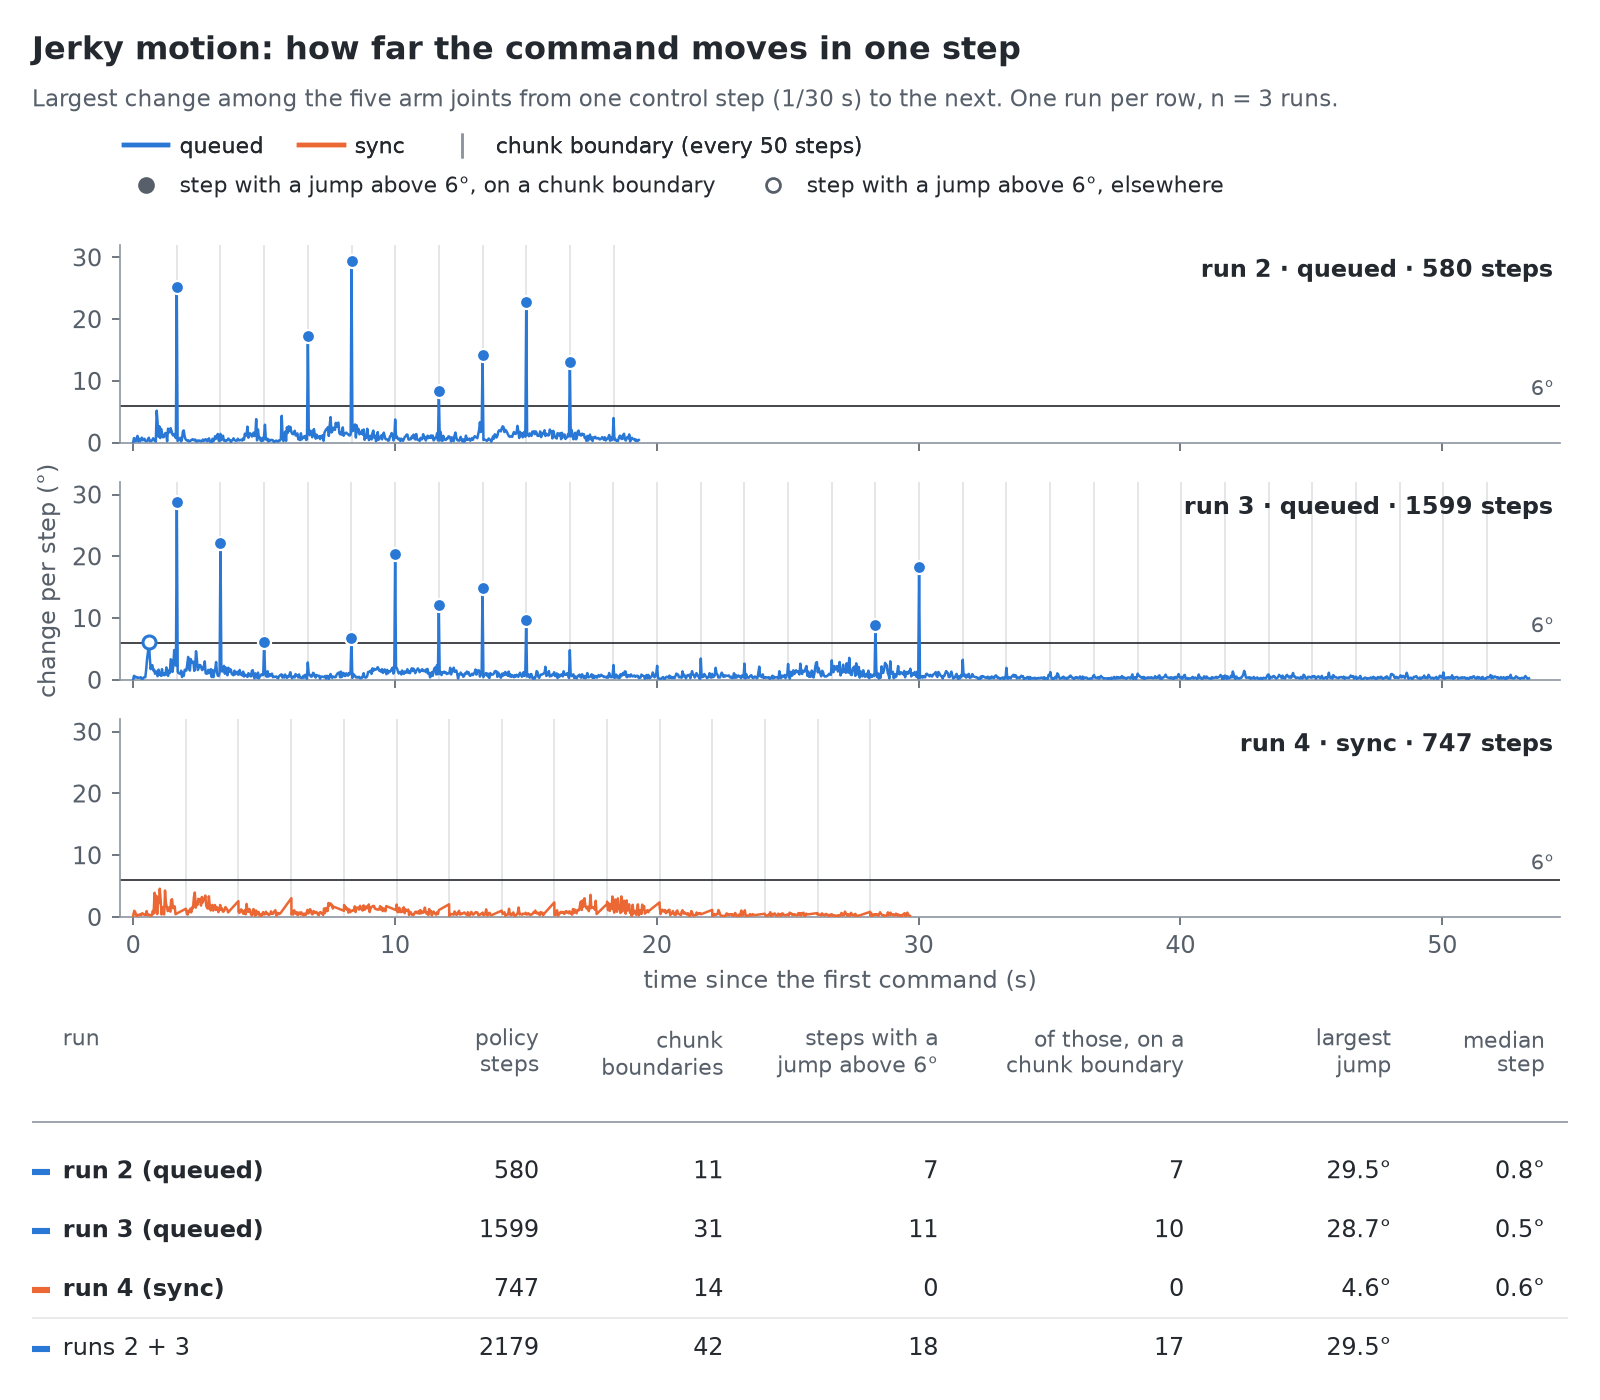
For every control step, how far the commanded pose moved since the previous
step: the largest change among the five arm joints, in degrees. Runs 2 and 3
used the queued inference setting, run 4 used sync; all three asked for
middle center. The grey lines are chunk boundaries, every 50 steps.
What it shows. In the two queued runs, 18 steps jump by more than 6°, and 17 of them sit on a chunk boundary (7 of 7 in run 2, 10 of 11 in run 3). The largest is 29.5°, against a median step of 0.8° and 0.5°. Not every boundary jumps: 17 of the 42 do. In run 4 no step exceeds 6° (the largest is 4.6°); instead the arm pauses for 0.4 s at each of its 14 chunk boundaries, which is why its grey lines are farther apart.
What it does not show. This is one run per row on one evening, with the
sync run made last; it is not a controlled comparison and gives no rate at
which the queued setting fails. The 6° line is the convention of the write-up,
not a property of the arm. The chart shows commands, not motion.
Waiting before the start, and the length of a move
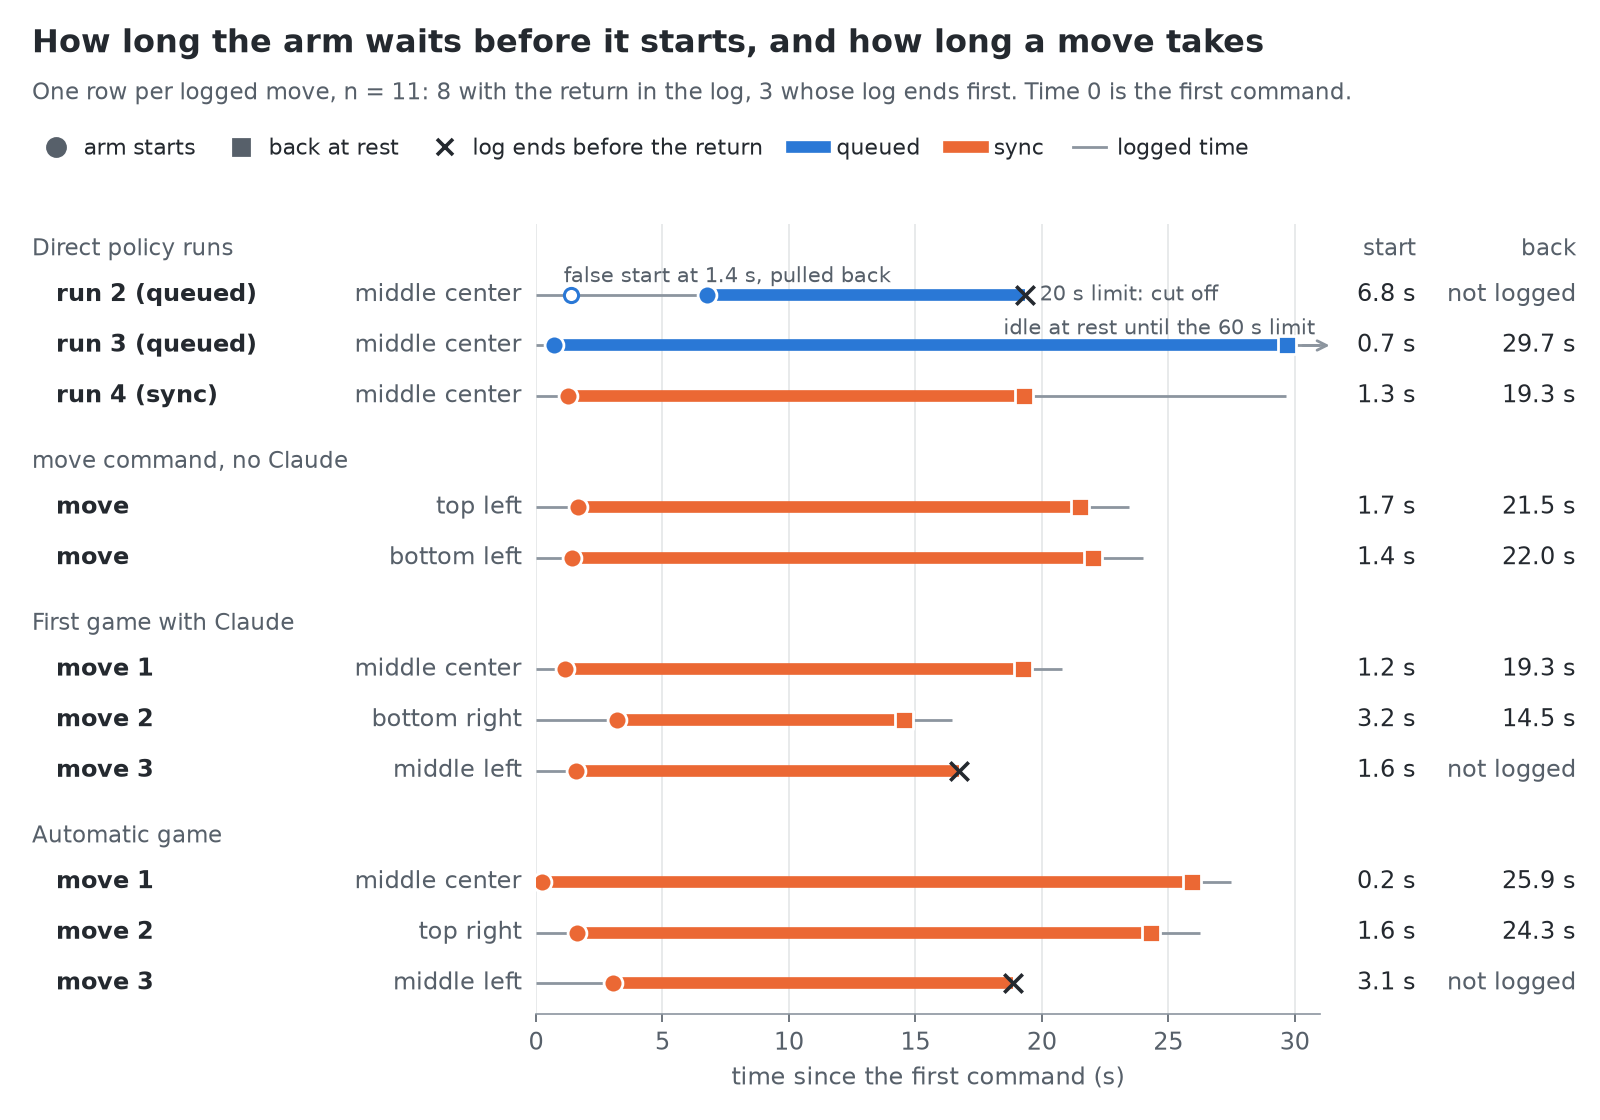
For 11 logged moves, when the arm starts and when it is back. Time 0 is the
first command. The arm has started when the commanded pose of any arm joint is
more than 10° from the rest pose; if it is pulled back to rest first, the last
departure counts. It is back by the game script's own rule: the first of 45
consecutive commands with shoulder_lift and elbow_flex within 8° of rest.
What it shows. Run 2 (queued) moved at 1.4 s, was pulled back, started at
6.8 s and was cut off by its 20-second limit at 19.3 s with the X still in the
gripper. Run 3 (queued) started at 0.7 s and was back at 29.7 s. The 9 sync
moves started between 0.2 and 3.2 s (median 1.6 s); the 7 of them whose return
is in the log were back between 14.5 and 25.9 s (median 21.5 s). For the third
move of each game the log ends 2.3 s and 2.6 s after the gripper was commanded
open, with the arm still over the cell, so there is no return time.
What it does not show. It is not a comparison of waiting between the two
settings: there are two queued moves, and the wait has a second cause in the
data (the chart of the demonstrations, below). The times leave out the first
inference before the first command: 0.38 to 0.66 s in the game-script logs,
not logged in the direct runs. The game script itself reports longer moves,
because it ends a move 1.5 s after the arm is back: 23.4 s and 24.0 s for the
two move runs. Three runs are not in the chart: run 1 was not logged, and in
two logs the arm never left rest (the accidental run and the run with an empty
pick slot).
The demonstrations
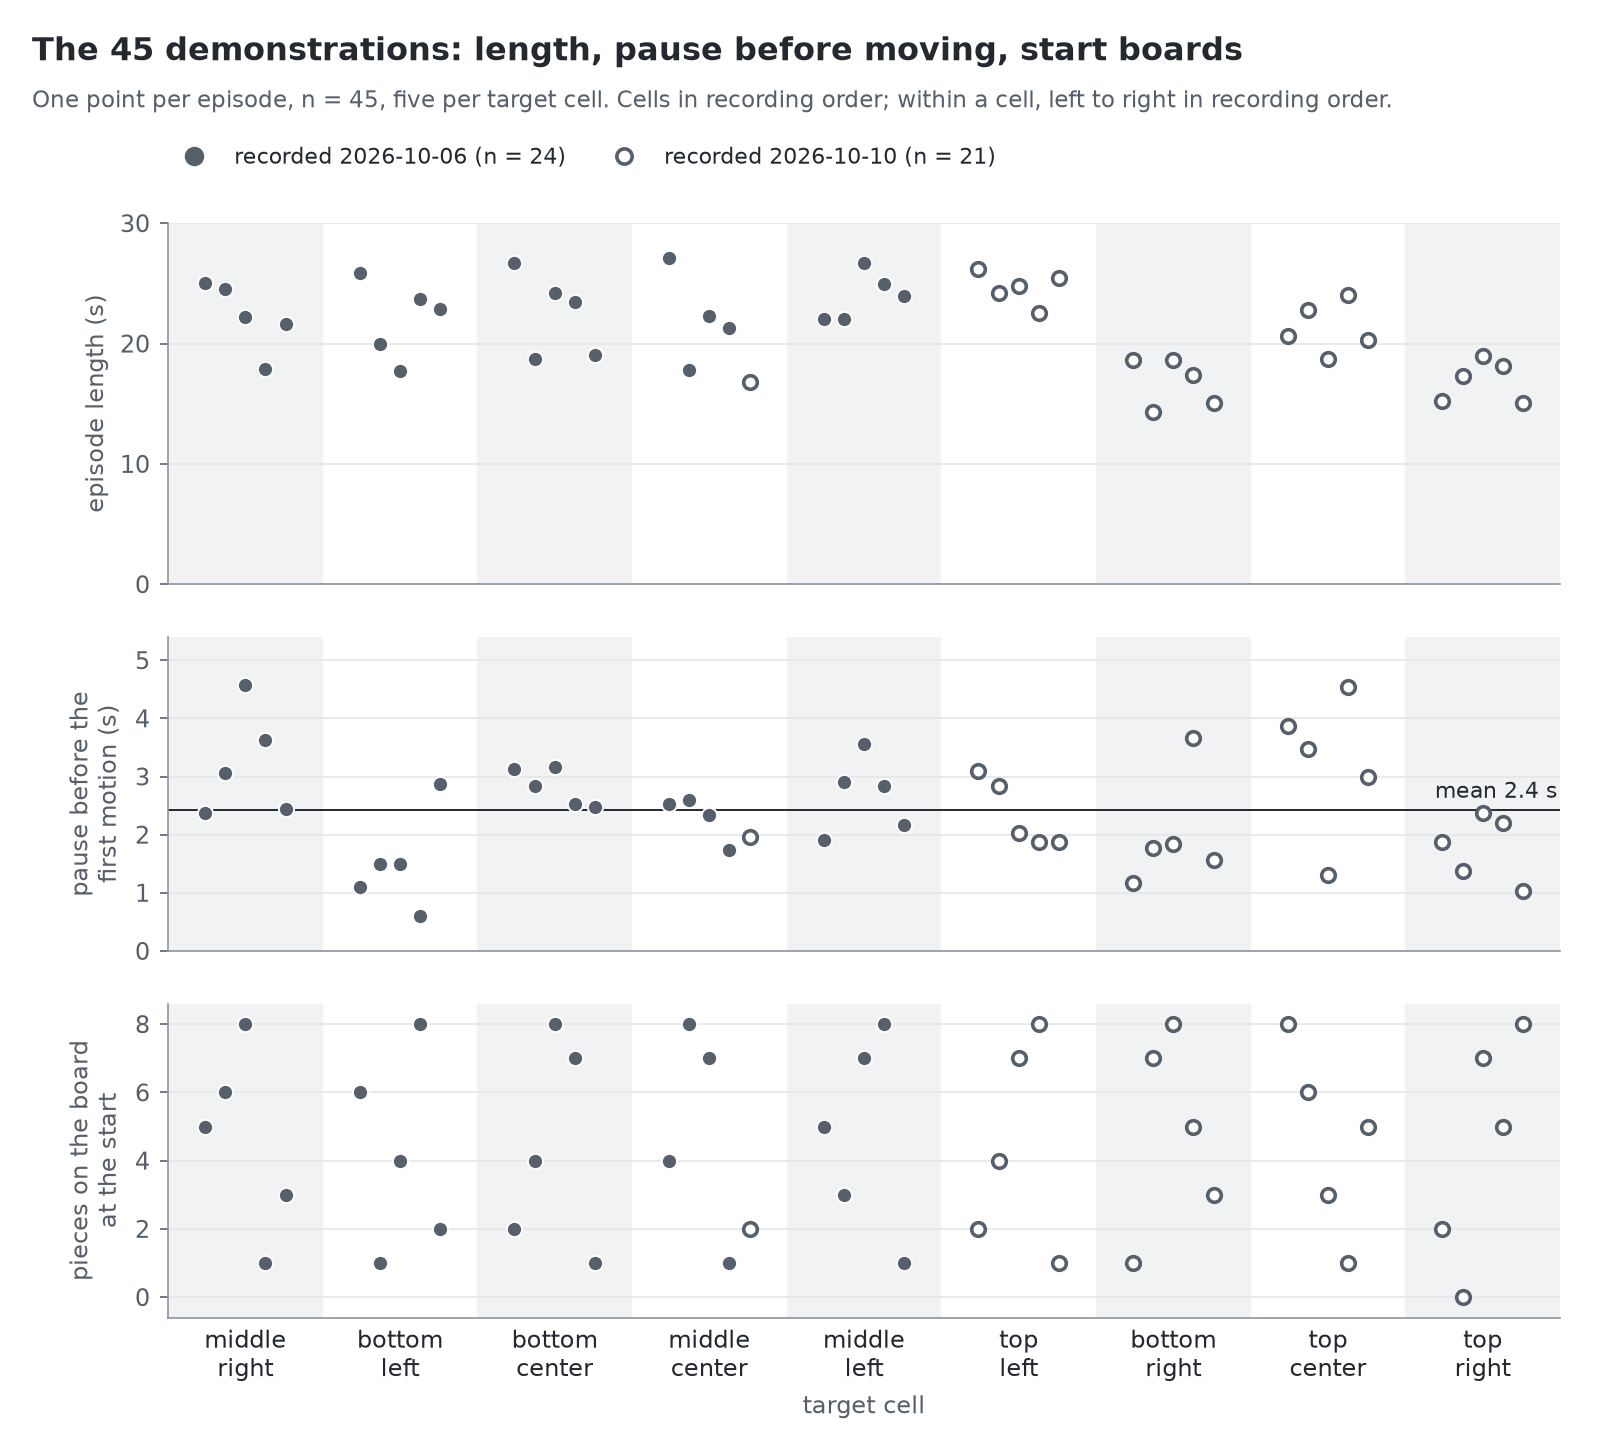
The 45 episodes of the clean training set, from their joint data; the videos
were not read. Top: episode length. Middle: the pause before the first motion,
defined as the time of the first frame in which any arm joint of the recorded
action (the leader arm, so the operator's hand) is more than 3° from its value
in the first frame. Bottom: the number of pieces on the start board, from
rounds/round1.md.
What it shows. Episodes last from 14.3 to 27.1 s (median 22.0 s). Those
recorded on the second day are shorter, with a median of 18.7 s (n = 21)
against 22.6 s (n = 24), but not in every cell: top left, recorded on the
second day, runs from 22.6 to 26.2 s. The pause before the first motion is
2.4 s on average (median 2.4 s, from 0.6 to 4.6 s), and no episode starts
within the first half second. In every cell the start boards go from at most 1
piece to all 8 other cells filled.
What it does not show. Cell and recording day cannot be separated: each cell was recorded in one block on one day, apart from one re-recorded episode. With the measured state of the follower arm instead of the recorded action, the mean pause is the same 2.4 s and the longest is 4.8 s, but 6 episodes then register motion in the first half second, because the follower is still settling. That the policy learned to wait from these pauses is the write-up's reading (first runs on the arm); the chart only shows that the pause is in the data.
Where the arm was asked to go
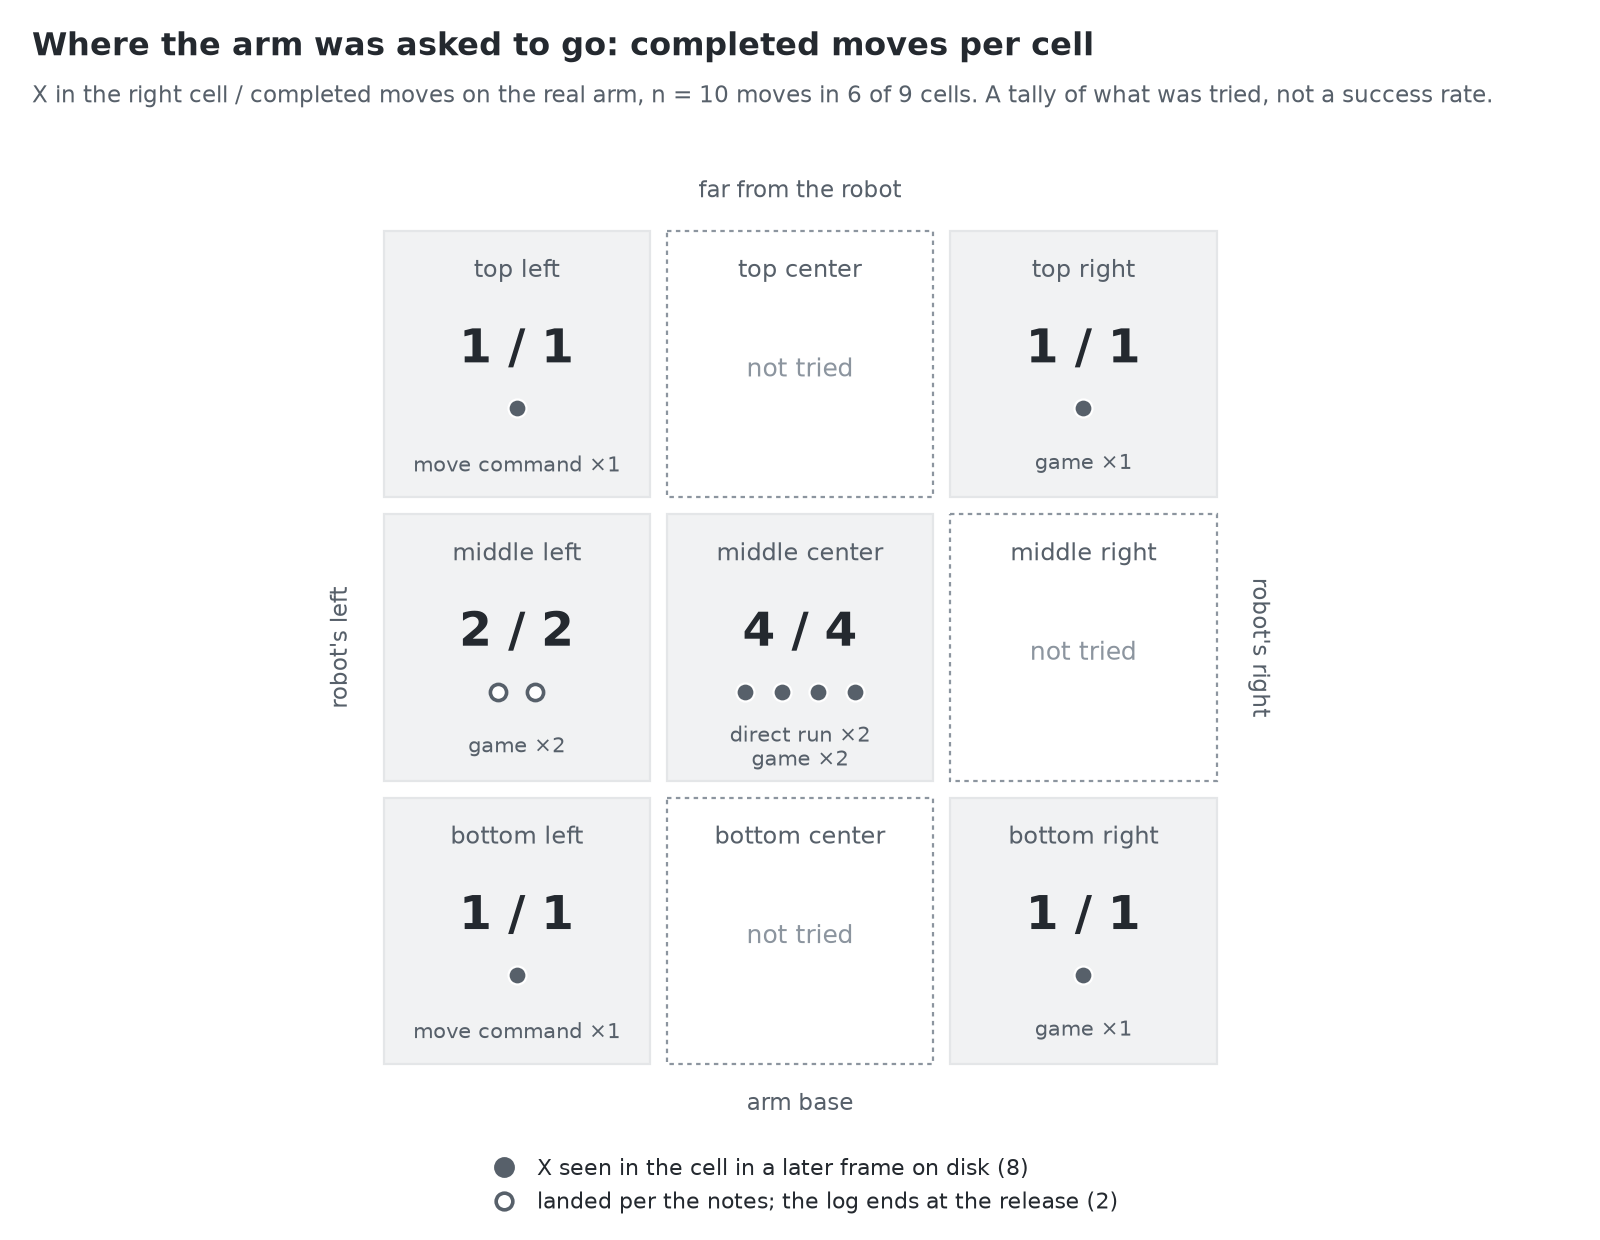
A tally per cell of the moves that the project notes count as completed on the real arm, and in how many of them the X ended in the right cell.
What it shows. 10 moves, 10 in the right cell, over 6 of the 9 cells:
middle center four times, middle left twice, four cells once.
top center, middle right and bottom center were never tried. For 8 of
the 10 moves the X can be seen in the cell in a later frame on disk. For the
other 2, the third move of each game, the log ends at the release, and that
the X landed rests on the notes of that evening.
What it does not show. This is a tally of what was tried, not a success rate: no cell was tried more than four times, the moves were not planned as trials, and runs that did not complete are left out (run 1, run 2, and the two logs in which the arm never left rest). "In the right cell" was judged by eye, in the automatic game also by Claude reading the board; how well the X is centred was not measured.
What has not been measured
- A success rate. Ten moves on one evening are a tally. The plan calls for ten trials per cell on start boards held out from training; none of that exists yet, and three cells have not been tried at all.
- A baseline. No other policy, no earlier checkpoint and no other dataset size was run on the arm. The three inference settings were compared without the arm (the table in first runs on the arm); those numbers are not in the logs on disk and are not redrawn here.
- Inference time and observation age on the arm. The logs hold commands
and joint angles, not when an observation was taken. The 0.4 s pause of
syncis visible; the 0.6 to 1 second-old observations of the queued setting are not. - Placement accuracy. Whether the X is in the cell was judged by eye. Its position and rotation inside the cell were not measured.
- Run 1. It was not logged.
- Robustness. A shifted board, another light, a nearly full board on the arm: not tried. The write-up notes that the board held at most four pieces when the arm moved.
- Claude's side. Board reading (16 of 16 in the write-up) and the choice of cell need API calls and were not re-run for this page.
- The detectors in play. Their thresholds were compared with frames from two games. How often they trigger wrongly, or miss, during a game has not been counted.